Plotting trajectories
Enrico Spinielli
2024-04-12
Source:vignettes/trrrj-plotting.Rmd
trrrj-plotting.RmdIt is sometimes usefult to visually inspect flight trajectories. This
vignette provides some examples and code snippets that show how to plot
trajectories from Flight Radar 24 feed. In fact the snippets here can be
used with any dataframe of position reports containing at least
timestamp, longitude, latitude
and altitude fields.
Plotting
In order to get some sample trajectory data, you can use the
trrrj package datasets:
-
flts: 41 flights from FR24 for 2017-02-05 and 2017-02-05, check the documentation via?flts -
poss: ADS-B positions reports forflts, check the documentation via?poss -
cprs: CPR’s matchingflts, check the documentation via?cprs
We now plot the ADS-B positions just for one flight, flight
RYR19QK from Comiso to Malpensa:
| date | flight | callsign | equip | fr24_id | nm_id | adep_icao | adep_iata | ades_icao | ades_iata |
|---|---|---|---|---|---|---|---|---|---|
| 2017-02-06 | FR8730 | RYR19QK | B738 | 207752905 | 884714 | LIMC | MXP | LICB | CIY |
We can now plot the ADS-B trajectory:
europe <- c(left = 5, bottom = 35, right = 30, top = 52)

# let's just focus on 1 flight
trj_adsb <- poss %>%
  dplyr::filter(flight_id == 207752905)

trrrj::plot_flight_horizontal(trj_adsb, bbox = europe)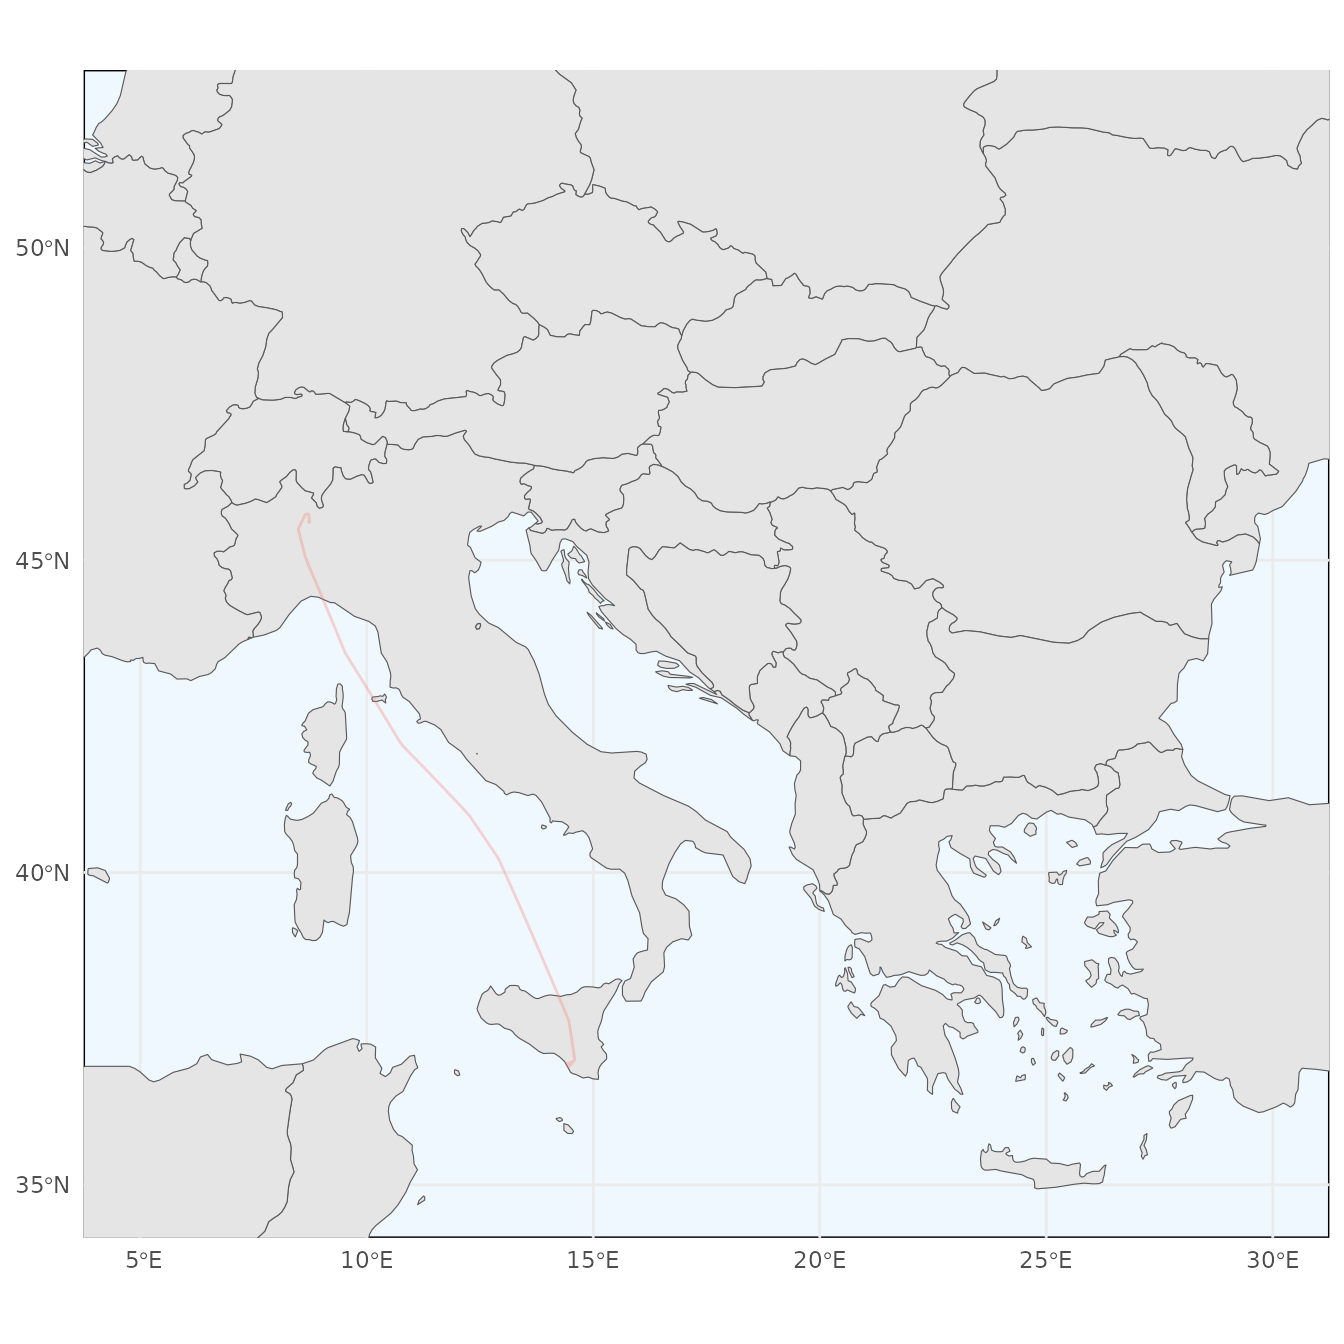
2D plot via ggmap
and the one from the CPRs:
trj_cpr <- cprs %>%
  filter(callsign == "RYR19QK")

trj_cpr %>%
  trrrj::plot_cpr_horizontal(europe, linewidth = 1.3, colour = "blue")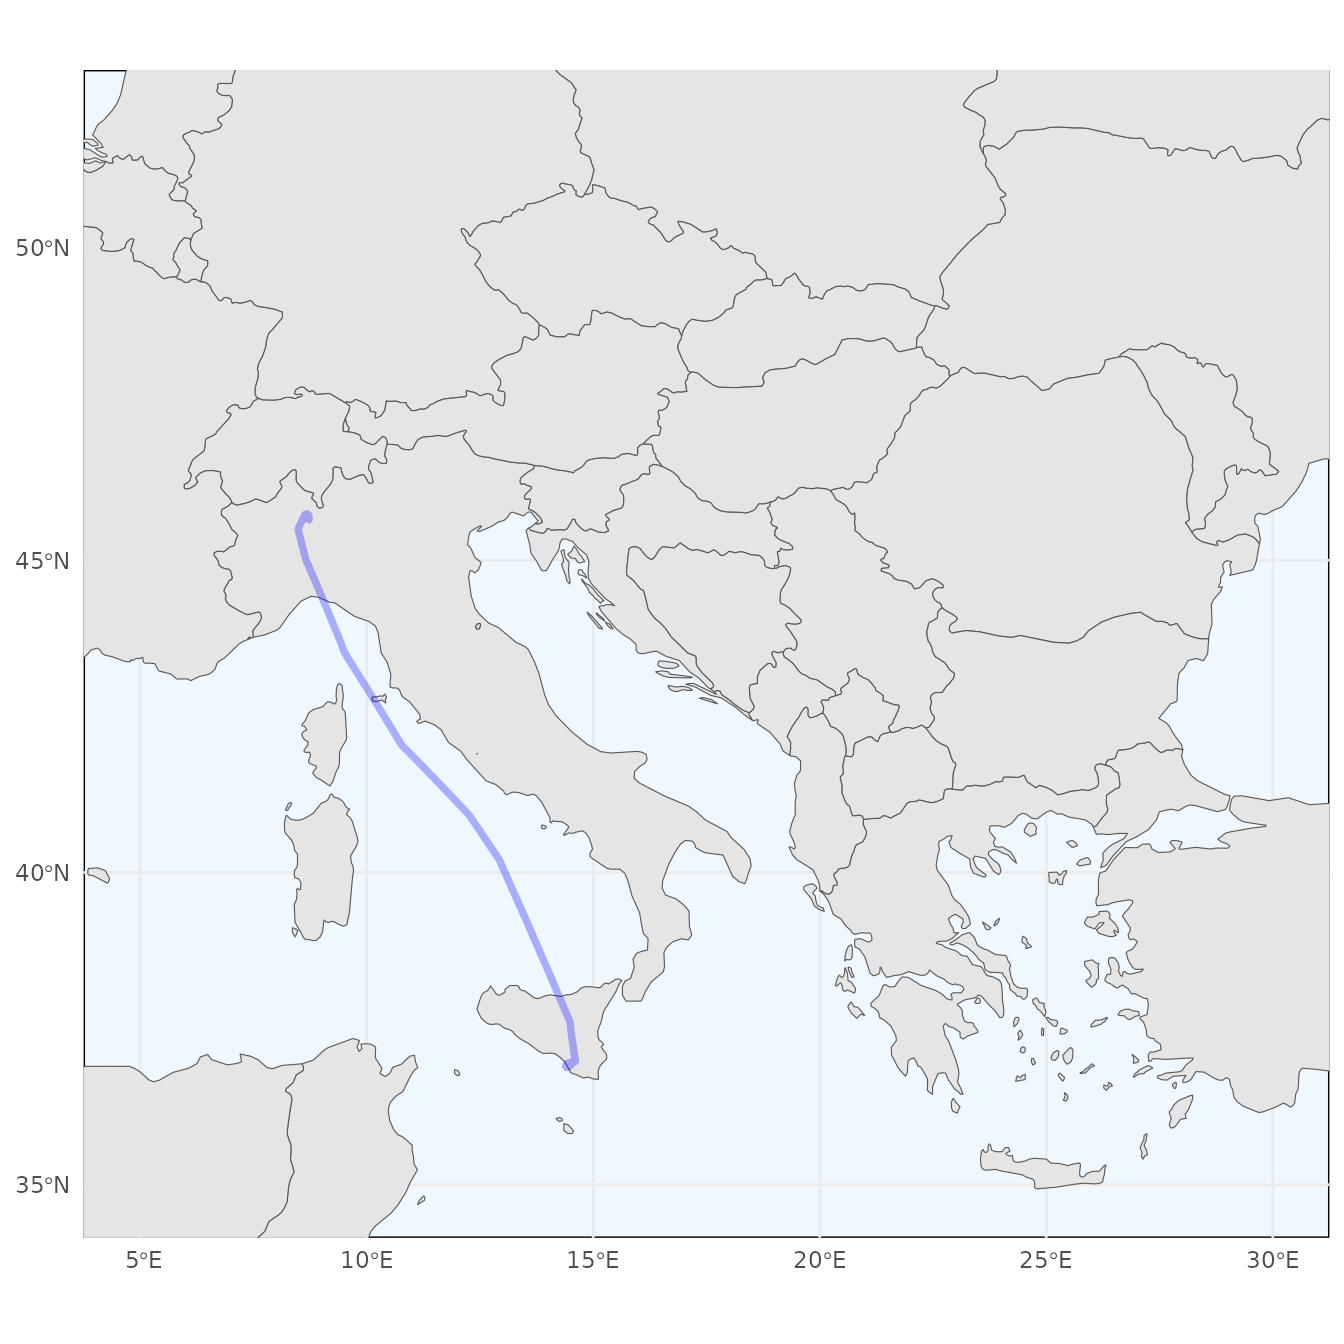
2D plot via ggmap
We can also see the vertical profiles vs distance (for the ADS-B trajectory):
plot_flight_vertical_distance(trj_adsb %>% cumulative_distance())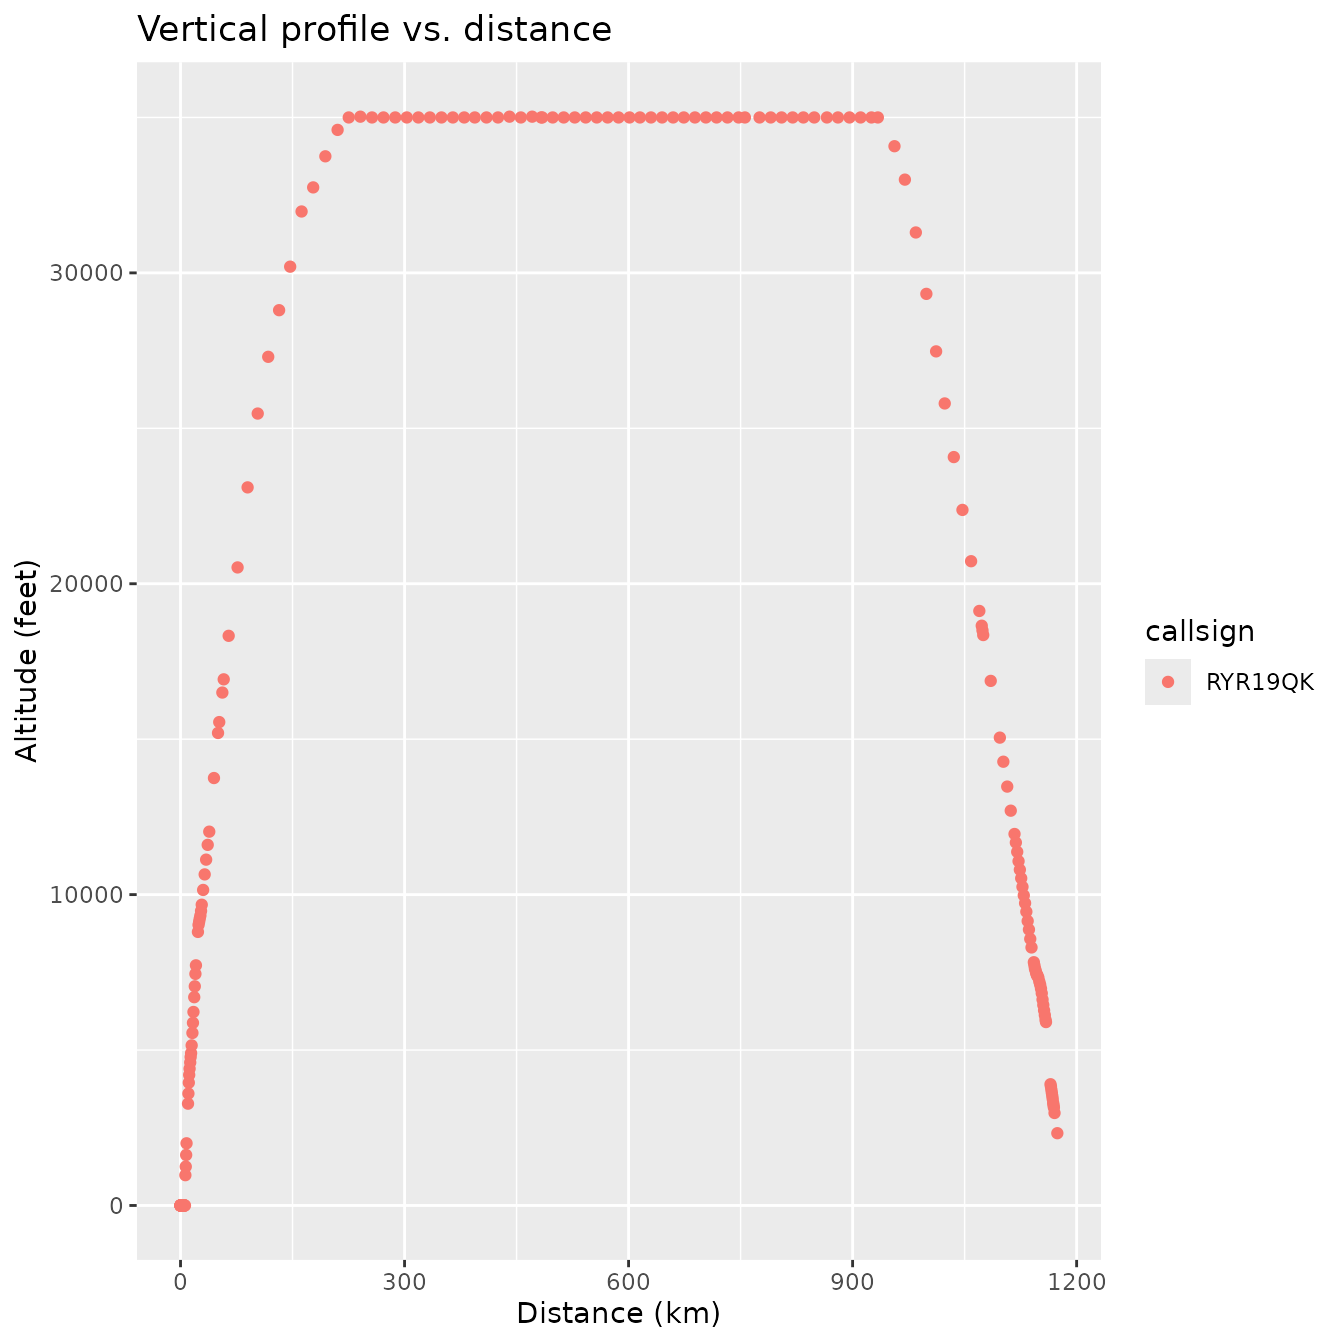
Flight’s vertical profile vs. distance
or time:
plot_flight_vertical_time(trj_adsb %>% cumulative_time())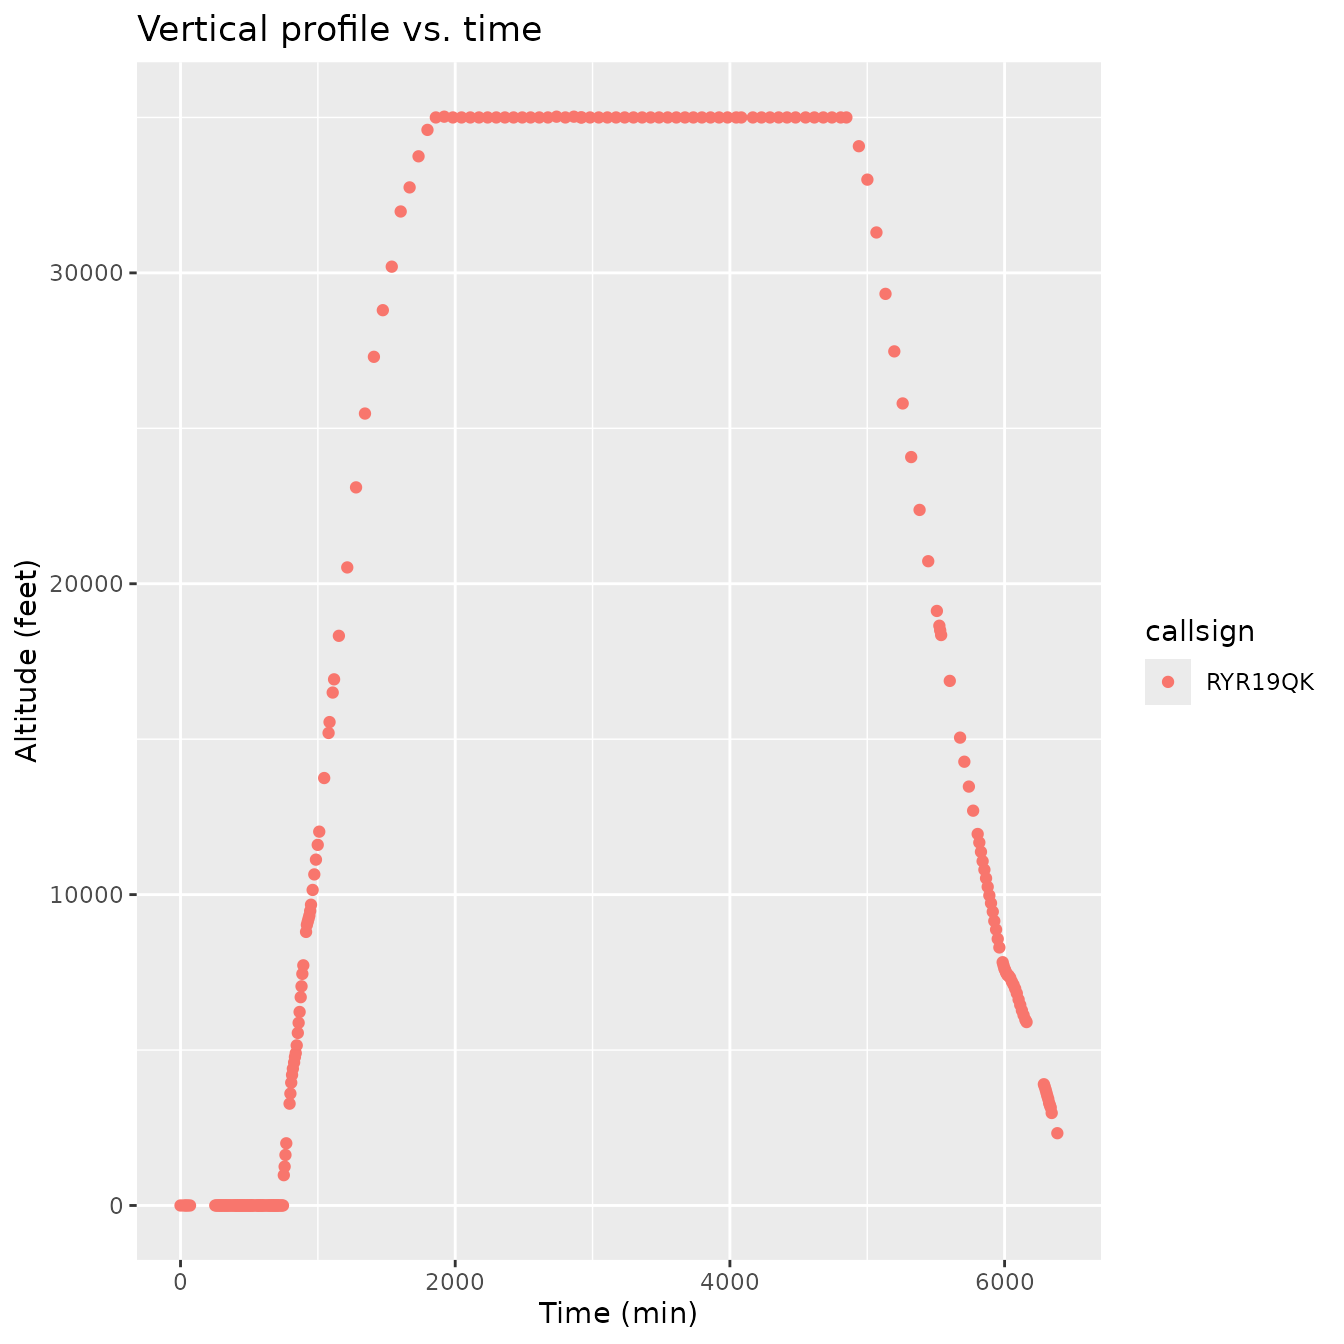
Flight’s vertical profile vs. time
Now let’s plot all CPR trajectories (with automatic bounding box):
cprs %>%
  plot_cpr_horizontal(linewidth = 1.3)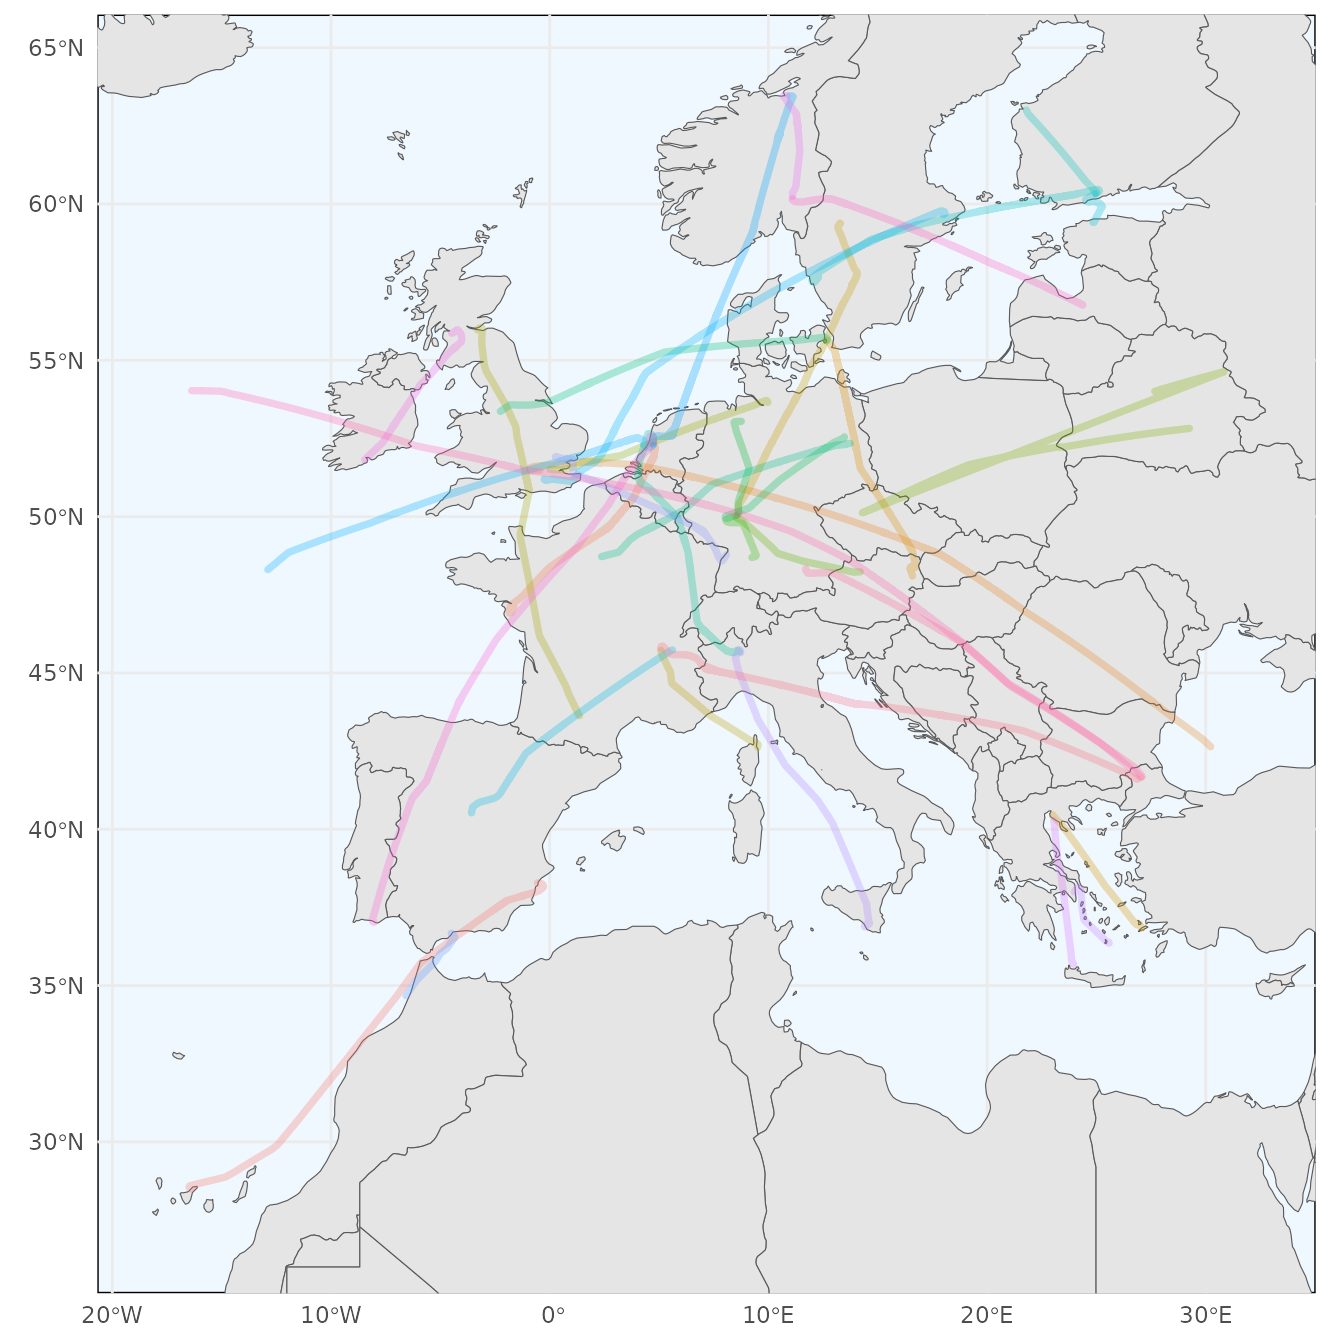
A map of all sample CPR trajectories
Base map: Europe
The pruatlas package provides a base map for Europe
using a Lambert Azimuthal Equal-Area projection. It could be a useful
package to further extend for plotting trajectories. It is on PRU’s
github account, euctrl-pru/pruatlas.
Retrive FR24 ADS-B data from DB
The trrrj package provides an API to retrieve FR24 data
from the DB. The use case here is for flights around an airport.
Before continuing BE CAREFUL about how to use it, you could get a lot of data back and il could take a lot of time.
Let’s say you want to retrieve the arrival flow to Stavanger airport in Norway for the 6th Sep 2017, then you need to issue the following command (showing the first 10 ones only):
svg20170906flt <- export_flights_at_airport_fr24("2017-09-06T00:00:00Z",
                                                 "2017-09-07T00:00:00Z",
                                                 "SVG",
                                                 flow = "ARR")
# fake the ROracle call
load(file = paste0(here::here(), "/data/flts.rda"))

svg20170906flt <-  flts %>%
  as_tibble() %>%
  filter(real_to == "BRU")

knitr::kable(
  head(svg20170906flt, 10),
caption = "Arrival flights at Stavanger airport, Norway, on Sep 6, 2017 (10 only)")| flight_id | aircraft_id | reg | equip | callsign | flight | schd_from | schd_to | real_to | date |
|---|---|---|---|---|---|---|---|---|---|
| 207635488 | 4509122 | OOSNB | A320 | BEL3292 | SN3292 | TLV | BRU | BRU | 2017-02-05 |
To get the position reports 40 NM around the airport for those flights (showing the first 10 ones):
library(trrrj)
# TODO: handle the case when building w/ Oracle DB
svg20170906pos <- export_flights_at_airport_fr24(
  "2017-09-06", "2017-09-07",
  "SVG", 5.638, 58.877,
  flow = "ARR",
  radius = 40)
# knitr::kable(head(svg20170906pos, 10))
Then prepare the data and then plot:
svg20170906pos <- svg20170906pos %>%
  rename(longitude = LON, latitude = LAT) %>%
  mutate(longitude = as.numeric(longitude), latitude = as.numeric(latitude))

svg20170906flt <- svg20170906flt %>%
  rename(callsign = CALLSIGN)

svg20170906pos <- svg20170906pos %>%
  left_join(svg20170906flt)

plot_flight_horizontal(svg20170906pos)
(File) Archived Trajectories
FR24 archive files can be accessed with standard R tools like
readr to retrieve the flight list for some of the companion
sample files in this package:
library(trrrj)
library(dplyr)
library(purrr)
library(readr)

######## flights
flights_dir <- system.file("extdata", package = "trrrj")
flights_csvs <- dir(flights_dir, pattern = "201702.._flights\\.csv", full.names = TRUE)
flights <-  purrr::map_df(flights_csvs, read_csv)
Here are the first 10 entries (some variables omitted):
| flight_id | reg | equip | schd_from | schd_to | real_to |
|---|---|---|---|---|---|
| 207610917 | OKYBA | A333 | PRG | ICN | ICN |
| 207541132 | EIEBP | B738 | CHQ | SKG | SKG |
| 207587763 | GCIXW | E170 | HAM | LCY | LCY |
| 207507520 | VTANP | B788 | AMD | LHR | LHR |
A sample of FR24 flight data is available as flts
dataset in the package. See also the relevant help page,
?flts.
(File) Archived Positions
ADS-B Positions
The trrrj package provides helpes to read position
report files from FR24 archive data feed. In order to read the ADS-B
position reports for the days from the previous section:
######## positions
poss_dirs <- c("20170206_positions", "20170205_positions")
poss_dirs <- system.file("extdata", poss_dirs, package = "trrrj")
poss_csvs <- dir(poss_dirs, pattern = "201702.._.*\\.csv", full.names = TRUE)
positions <- purrr::map_dfr(poss_csvs, read_positions_fr24)

# augment with flight info
positions <- positions %>%
  left_join(flights, by = "flight_id") %>%
  filter(!is.na(callsign), callsign != "YELLOW6")
The first 10 entries (some variables omitted) for flight “AIC175”
(flight_id = 207507520) are:
| flight_id | timestamp | altitude | heading | latitude | longitude | speed |
|---|---|---|---|---|---|---|
| 207507520 | 2017-02-05 04:56:15 | 38000 | 291 | 36.18664 | 52.95428 | 425 |
| 207507520 | 2017-02-05 04:57:17 | 38000 | 291 | 36.23184 | 52.81566 | 424 |
| 207507520 | 2017-02-05 04:58:18 | 38000 | 291 | 36.27630 | 52.67845 | 424 |
| 207507520 | 2017-02-05 04:59:20 | 38000 | 291 | 36.32181 | 52.53754 | 424 |
| 207507520 | 2017-02-05 05:00:21 | 37975 | 291 | 36.36580 | 52.40049 | 422 |
| 207507520 | 2017-02-05 05:01:22 | 38000 | 291 | 36.40934 | 52.26424 | 423 |
| 207507520 | 2017-02-05 05:02:26 | 38000 | 291 | 36.45547 | 52.11931 | 423 |
| 207507520 | 2017-02-05 05:03:28 | 38000 | 291 | 36.49900 | 51.98169 | 424 |
| 207507520 | 2017-02-05 05:04:30 | 38000 | 291 | 36.54406 | 51.83893 | 423 |
| 207507520 | 2017-02-05 05:05:33 | 38000 | 291 | 36.58923 | 51.69468 | 425 |
A sample of FR24 ADS-B position report data is available as
poss dataset in the package. See also the relevant help
page, ?poss.
(File) Archived Correlated Position Reports (CPR’s)
The trrrj package provides facilities to read NM’s
archived CPR files. In order to import all cprs for the 2 demo days:
# read all 5th and 6th February 2017 CPR's files
# cprs_dirs <- system.file("extdata", package = "trrrj")
# cprs_delims <- dir(
#    cprs_dirs,
#    pattern = "1.2017020.1001tacop304ARCHIVED_OPLOG_ALL_CPR\\.gz",
#    full.names = TRUE)
cprs_delims <- c(
  trrrj_example("1.201702051001tacop304ARCHIVED_OPLOG_ALL_CPR.gz"),
  trrrj_example("1.201702061001tacop304ARCHIVED_OPLOG_ALL_CPR.gz"))

poss_cpr <- purrr::map_dfr(cprs_delims, read_cpr)
and then show the first 10 entries (some variables omitted) for the same flight, “AIC175”, as for the ADS-B positions:
| tact_id | timestamp_track | callsign | flight_level | track_heading | latitude | longitude | track_speed |
|---|---|---|---|---|---|---|---|
| 847918 | 2017-02-05 07:25:16 | AIC175 | 400 | 304.7772 | 42.63778 | 30.22139 | 461 |
| 847918 | 2017-02-05 07:25:25 | AIC175 | 400 | 311.4294 | 42.65250 | 30.20500 | 480 |
| 847918 | 2017-02-05 07:25:50 | AIC175 | 400 | 312.6158 | 42.68667 | 30.14944 | 462 |
| 847918 | 2017-02-05 07:25:54 | AIC175 | 400 | 309.5233 | 42.69167 | 30.14389 | 457 |
| 847918 | 2017-02-05 07:26:19 | AIC175 | 400 | 311.1658 | 42.72667 | 30.08583 | 462 |
| 847918 | 2017-02-05 07:26:28 | AIC175 | 400 | 307.4578 | 42.73833 | 30.06889 | 463 |
| 847918 | 2017-02-05 07:26:48 | AIC175 | 400 | 311.4350 | 42.76778 | 30.02306 | 464 |
| 847918 | 2017-02-05 07:26:57 | AIC175 | 400 | 308.3697 | 42.78000 | 30.00639 | 464 |
| 847918 | 2017-02-05 07:27:21 | AIC175 | 400 | 311.6161 | 42.81611 | 29.94917 | 466 |
| 847918 | 2017-02-05 07:27:30 | AIC175 | 400 | 308.6775 | 42.82833 | 29.93306 | 465 |
A sample of NM’s CPR’s data is available as cprs dataset
in the package. See also the relevant help page, ?cprs.